DJI Mavic, Air and Mini Drones
Friendly, Helpful & Knowledgeable Community
Join Us Now

Differences between the csv's for AirData and PhantomHelp logviewer for logs from fly app 1.3 & or 1.4.8

  • Thread starter Deleted member 103366
  • Start date
D

Deleted member 103366

Guest
The csv output from Phantomhelp logviewer obviously contains a lot more data 160+ columns vs 46? columns in Airdata.
By comparing the names of entries and the stored values for the same or VERY close milli Sec time stamps I have been able to relate most of the Airdata column names to what I believe are the corresponding entries in the Phantomhelp csv but I and struggling to match some Airdata entries or wish to confirm whether or not what I think they are is correct.

1) are the following two heights, Airdata columns 6 & 7, derived from GPS data and is the second one relative to sea level?

height_above_ground_at_drone_location(feet)
ground_elevation_at_drone_location(feet)

2) in the csv's I have compared so far I can not find (going by the stored value) entries in the Phantomhelp csv for
a) speed(mph) column 10,
b) current(A) column 40----------- I guess this might be the battery current but, that I recollect, I have not seen any current values in the csv output from Phantomhelp for any of my txt flight logs from any of my DJI drones. From memory a column exists in the Phantomhelp csv but I have not seen it populated.
c) flycStateRaw what is it?

Thanks
 
Height above ground and ground elevation are computed values, using the aircraft location and a DEM. They are not data fields from the aircraft.

Speed is self-explanatory - horizontal ground speed.

Current is total battery current.

flycStateRaw is the set of codes for the flight mode:

0 Manual​
1 ATTI​
6 P-GPS​
7 GPS CL​
9 GPS_HotPoint​
10 Assisted takeoff​
11 Auto takeoff​
12 Auto landing​
14 NaviGo - waypoint​
15 GoHome​
17 Joystick​
19 Cinematic​
26 NaviSubMode_Tracking​
27 TapFly​
28 PANO​
29 Farming​
31 Sport​
32 Sport​
33 Forced landing​
37 NaviAdvLanding​
38 Tripod​
39 TrackHeadlock. (Track Spotlight?)​
41 Engine start​
43 Detour​
46 Timelapse​
 
While on the subject of logs - a few of you paste plots of various flight factors - rudder position, elevator position, yaw vs compass, etc. - and I've been looking for something like this (no, I do not want to code from scratch); the software tools I have found appear to be specific to .DAT sourced logs, and don't appear to be compatible with .TXT sourced logs. Since I am Air 2, no DAT converters available - nor, do I find anything like them on my drone or controller (maybe DJI syncs then deletes and I need to turn off autosync).

I think I've asked before and gotten the "privately developed" answer a few times. It wasn't clear if the tools accept .DAT and .TXT - so maybe I'm asking the wrong questions. So if homemade tools are the only way to do plots, what resource was used to gather the variables from the .TXT or .DAT files? Does the DJI dev kit have these structures defined? Or, did you second hand reverse engineer the data from .CSV and such?
I think those questions are all answered in the post linked in my signature, which describes the options for decoding and viewing both DAT and TXT logs.
 
I installed csvView a few days ago and tried it with my Mavic Air 2 / DJI Fly 1.4.8 .TXT logs - said they were not compatible.
The app also didn't say much about any 'embedded' tools for expanded conversion capabilities. I did not try any standalone versions of the TxttoCSV ... but wouldn't have in any case because of the 'no visualization' issue.

I use FlightReader and AirData to do conversions ... I'd just like to have a bit more user friendly plots of what the controls and sensors are doing when I see odd things.

Thanks - I guess I am left with to growing my own.

I'm not clear what you are trying to solve. As the post that I referenced explains, Fly app TXT files are not decodable by TXTlogToCSVtool, and therefore also not readable directly by CsvView. But CsvView will take the .csv files from PhantomHelp and AirData and display the data.
 
I'm not clear what you are trying to solve. As the post that I referenced explains, Fly app TXT files are not decodable by TXTlogToCSVtool, and therefore also not readable directly by CsvView. But CsvView will take the .csv files from PhantomHelp and AirData and display the data.
Reading in a few places, there were claims the TextReader could in fact read DJI Fly .TXT files after 1.2.2 ... even a release specifically for the mini (tho I am flying an Air 2). But the ones I found were pretty old binaries - 2018 and 2020 respectively.

Plus, the CSVtool I installed - v4.2.4 - did NOT accept my csv - though I can't be sure which tool created the particular csv I tried. So could have been either FlightReader, PhantomHelp, or from Airdata. The fields make me think it was one of the the prior two from Michael's code.

Here's examples of the plots I would like to replicate:
 
Last edited:
So feeling like I must be dense, I went back, started from scratch, and reinstalled everything, and eventually found that the .csv sample I tried with CSVview was reported as corrupt by FlightReader. Of course FlightReader shows corrupt files, but I wasn't looking at that screen when I was playing with CSVview.

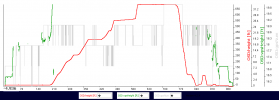
So - with a fresh install of CSVview and a fresh rehash of the corrupt log, I finally got to this, which is more or less what I was looking for.

While some might ask what was I doing at 700', I was over terrain, always within 200 agl.

What I am trying to understand better is why the 0.0 foot home altitude changed to -9.2' between start and finish of the ~16 minute flight. This plot shows it reasonably well. But I wish there were a way to set the scales to clip the data - I'm only interested in the near ground numbers.

Basically, the first 30 seconds I was over land, but then as I flew out over the river why is the visual system all over the map - especially when I was hovering over the river (first 200 seconds) - note the null values and then an increase from about 16' up to 32' then zero again as I climbed above the launch altitude. The drop to 5' at 210 seconds is also just weird.

And the gross variability at the last 100 seconds of the flight as the drone returned home. The return flight altitudes may have been influenced by water depth, up until I was over land again - when the 10' offset was quite obvious. This offset showed up on a few flights, one of which the drone virtually refused to land and forced me to hand catch. Which is why I am curious to understand it.

Plots.png

A properly scaled plot:
DJIFlightRecord_2021-09-09_(15-40-41)-aircraft-2.png
 
Last edited:
What I am trying to understand better is why the 0.0 foot home altitude changed to -9.2' between start and finish of the ~16 minute flight.

It's common and normal for the indicated altitude to vary over the duration of a flight.
That's the nature of working with a barometric sensor.
You cannot rely on the indicated height to be completely accurate.
Errors of 10 ft and more between the beginning and end of a flight are common.
The drop to 5' at 210 seconds is also just weird.
... This offset showed up on a few flights, one of which the drone virtually refused to land and forced me to hand catch. Which is why I am curious to understand it.
Post the .txt file and I might be able to work out what you are asking about.
 
But I wish there were a way to set the scales to clip the data - I'm only interested in the near ground numbers.
......
It's a bit primitive but you can zoom in and out on the Y axis.

Two zoom methods are supported. The first uses the left-mouse-down-and-drag gesture to select the area you want to zoom in on. The zoom area will appear as a yellow highlighted area. To zoom out after using this zooming method you must the Zoom Reset button in the SigPlayer menu bar.

The second method uses the mouse wheel is used to zoom in and out. Place the cursor at center of the desired zoom. To zoom in the Y axis (vertically) hold the shift key down and roll the wheel forward to zoom in and roll the wheel back to zoom out.

The scale of a Y axis can't be specified directly though. To do that you will need a real data analysis package.
 
Thank you @BudWalker - I'd figured out zoom, but it doesn't effectively improve resolution of the lower numbers for comparison (trying to get the same scale of GPSalt and VPSalt.

So I took another flight, a full 28 minutes of hover in a garage. Drone essentially stationary except for elevation changes at forced landing. The GPSalt is pretty good over this constrained flight, no negative GPSalt, unlike the flight above, but the X-Y position was all over the map.
DJIFlightRecord_2021-09-28_(13-38-22)-aircraft.png

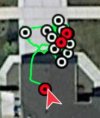
Lateral GPS drifting shown here. I'm guessing the fact VPS never went off-scale, the FC was able to constrain altitude based off the math of both GPS and pressure. But in other flights when it only has GPS, altitude suffers just as much error, complicating precision landings.

GPSdrift.JPG

What's not funny is in flights testing the batteries and this flight testing the MaxAir props, the drone was intent in landing even though I was banging on the "ABORT LANDING" or "X" icon, and had to use the stick to keep the drone off the ground. Not sure how the abort landing feature should work, but so far I'm not impressed. I've seen this behavior from the 4' here, to coming back at 180' to land.
 
Last edited:
Thank you @BudWalker - I'd figured out zoom, but it doesn't effectively improve resolution of the lower numbers for comparison (trying to get the same scale of GPSalt and VPSalt.

So I took another flight, a full 28 minutes of hover in a garage. Drone essentially stationary except for elevation changes at forced landing. The GPSalt is pretty good over this constrained flight, no negative GPSalt, unlike the flight above, but the X-Y position was all over the map.
View attachment 136243

Lateral GPS drifting shown here. I'm guessing the fact VPS never went off-scale, the FC was able to constrain altitude based off the math of both GPS and pressure. But in other flights when it only has GPS, altitude suffers just as much error, complicating precision landings.

View attachment 136274

What's not funny is in flights testing the batteries and this flight testing the MaxAir props, the drone was intent in landing even though I was banging on the "ABORT LANDING" or "X" icon, and had to use the stick to keep the drone off the ground. Not sure how the abort landing feature should work, but so far I'm not impressed. I've seen this behavior from the 4' here, to coming back at 180' to land.
By GPSalt I assume you are referring to the OSD:height data. That is the value computed by the FC from just the barometer data. There is also a GPS:heightMSL which comes from the GPS receiver.

If you want to zoom on OSD:vpsHeight and OSD:height independently then put them in separate SigPlayers. Unlike horizontal zooming, vertical zooming isn't synchronized between SigPlayers.

From your description the drone may have entered the Forced Landing mode because of a low battery.
 
Yeah - the naming conventions are definitely not well explained nor documented (in what I've discovered so far). In that second prop test, forced landing was due to battery state, and was part of the test to see how long the drone could stay in the air in ideal conditions. The first flight - the battery was at 23% at landing.

If my "GPSalt" is actually barometric altitude, then this whole thing makes even less sense.
 
I am curious, with regards to"forced landing", are you talking about more than one set of circumstances causing a forced landing?
If so what are they?

Whilst I do not have an MA2, with my drones the only forced landing that I KNOW of is the very low or perhaps "critical"-battery forced-landing when the battery is on its last gasps.
If you google it this has been quite well documented both in threads and youtube. Especially where this landing has been triggered whilst the drone is over water and the pilot has had to fight to keep their drone in the air whilst attempting, sometimes successful, sometimes not, to get their drone back over land or a dry landing spot before the battery gave out.
So too has the woolly nature of the response to joystick inputs during such a forced landing.
Then there is the following on p14 of the Air 2 manual
"The aircraft will land automatically if the current battery level can only support the aircraft long enough to descend from its current altitude. Auto landing cannot be canceled but the remote controller can be used to alter the direction of the aircraft during the landing process "

There may well be a forced landing if the connection between the controller and drone is lost and the drone has no GPS etc. but I can not comment on that other.
 
Last edited by a moderator:
Did another plot - the two height variables (height & altitude) are virtually identical. But the question I am having is why the change in home altitude at T-launch and T-land.
DJIFlightRecord_2021-09-09_(15-40-41)-aircraft-3.png
 

Attachments

  • DJIFlightRecord_2021-09-28_(13-38-22)-aircraft.png
    DJIFlightRecord_2021-09-28_(13-38-22)-aircraft.png
    36.1 KB · Views: 14
Last edited:
I am curious, with regards to"forced landing", are you talking about more than one set of circumstances causing a forced landing?
If so what are they?

Whilst I do not have an MA2, with my drones the only forced landing that I KNOW of is the very low or perhaps "critical" battery forced landing when the battery is on its last gasps.
If you google it this has been quite well documented both in threads and youtube. Especially where this landing has been triggered whilst the drone is over water and the pilot has had to fight to keep their drone in the air whilst attempting, sometimes successful, sometimes not, to get their drone back over land before the battery gave out.
So too has the woolly nature of the response to joystick inputs during such a forced landing.
Then there is the following on p14 of the Air 2 manual
"The aircraft will land automatically if the current battery level can only support the aircraft long enough to descend from its current altitude. Auto landing cannot be canceled but the remote controller can be used to alter the direction of the aircraft during the landing process "

There may well be a forced landing if the connection between the controller and drone is lost and the drone has no GPS etc. but I can not comment on that other.
The many cases of "forced landings" I've encountered were never a fully drained battery. The only time I've done that is in the garage testing battery life.

The worst case, where I had to hand catch the dang drone in panic mode because it wanted to land in a dirt pile next to my clean landing table, was after a Sport Mode excursion: mid flight, the Smart Controller reported the drone was landing due to battery state - the display looked like the battery was at zero, but the battery had only just hit 20%. The Orange and Red on the micro icon were washing out in full sun. RTH was initiated, but I overrode it to keep flying, changed more to P-GPS, and proceeded to fly back to home with a blaring "LANDING" voice on the controller.

Here's the log of that voyage. You'll need to decode the CSV to see all the warnings. A bit troubling is the log does NOT fully coincide with what actually took place. What I saw on the controller for aircraft state is not what the log recorded. I can't reconcile this - but I am normally a rational guy and do not doubt what I saw on the display. I have since started recording ALL flights on the controller. I have also avoided Sport Mode unless the drone is somewhere I can easily recover it.


Did another plot - the two height variables (height & altitude) are virtually identical. But the question I am having is why the change in home altitude at T-launch and T-land.
View attachment 136309
View attachment 136310
If you are referring to the offset in OSD:altitude, that's just barometric drift, either as the sensor changes temperature or the ambient pressure actually changes. A 2-meter change in pressure altitude is a very small change in pressure.
 
At the end of the day - I regard that specific sport mode flight as a bump in the night and have moved on.

The issue I'd like to understand better is why the HOME altitude is changing during flight. I know the land isn't moving up and down, and I know the GPS signal is variable, but everyone swears the drone mainly is using the barometer, and a 10' barometric change seems plausible over hours, but not 15 minutes: and the fact the GPS agrees with the barometer makes me think the height and altitude numbers are less reliant on the barometer than some will lead you to believe. At least in the Mavic Air 2 flight controller.

Anyway - perhaps I am beating that proverbial dead horse.

ps: next time I'm out I'll take my barometer and check the start-finish pressures.
 
Lycus Tech Mavic Air 3 Case

DJI Drone Deals

New Threads

Forum statistics

Threads
130,978
Messages
1,558,530
Members
159,968
Latest member
skyscansurveys