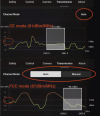
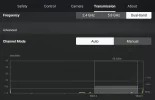
If that's the case, now I am totally confused again.I think the bars represent the 2.4GHz and 5.8GHz Frequencies.
I thought if the upper horizontal bar is at 91 dBm/MHZ, it's CE, and if at 87 dBm/MHZ, it's FCC.
What are the lower horizontal bar levels?
Looks like 105 dBm/MHZ for CE and 101 dBm/MHZ for FCC.
So CE mode horizontal lines are at 91 dBm/MHZ and 105 dBm/MHZ
FCC mode horizontal lines are at 87 dBm/MHZ and 101 dBm/MHZ
The difference in the upper horizontal lines is 4 dBm/MHZ and the difference in the lower horizontal lines is 4 dBm/MHZ
The upper horizontal line on the CE graph intersects the vertical dBm/MHZ scale at just above 90, which you indicate is 91.
The upper horizontal line on the FCC graph intersects the vertical dBm/MHZ scale at just below 90, which you indicate is 87.
What am I missing?

Last edited:


