I wanted to perform an experiment to see the rate of battery drain during flight. Obviously, I need a consistent flight profile. No user input required when experiment is started.
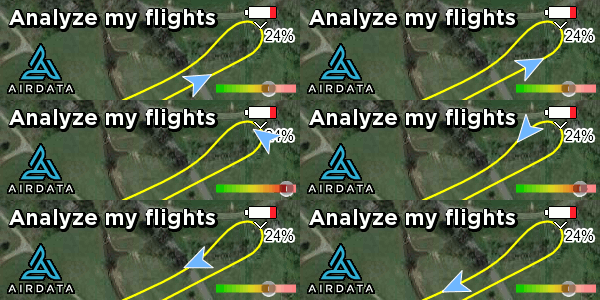
So, I decided to use Point of Interest mode, and let my Mavic fly in circles. Then use the flight logs to plot some trends. The flight path are 8+ perfect circles (1km circumference). Set speed was 36kph, but it was quite windy, so flight speed varied a bit (a still day would've been ideal). Basically, battery % and voltage drop is pretty much linear, between 100% and 30%. I didn't want to try 100% to 0%, cos I didn't want to reduce the battery life/health. Maybe there's a sharp drop between 10% and 0% if someone is keen to test.
I couldn't attach an excel here, so here are some pics.


Battery in %, 0 decimal, so I interpolated the % between integers.
I guess the setup can be used to test efficiency for speed (10kph, 20kph, 30kph, etc), prop comparison (standard, low noise, carbon fiber, etc)
So, I decided to use Point of Interest mode, and let my Mavic fly in circles. Then use the flight logs to plot some trends. The flight path are 8+ perfect circles (1km circumference). Set speed was 36kph, but it was quite windy, so flight speed varied a bit (a still day would've been ideal). Basically, battery % and voltage drop is pretty much linear, between 100% and 30%. I didn't want to try 100% to 0%, cos I didn't want to reduce the battery life/health. Maybe there's a sharp drop between 10% and 0% if someone is keen to test.
I couldn't attach an excel here, so here are some pics.


Battery in %, 0 decimal, so I interpolated the % between integers.
I guess the setup can be used to test efficiency for speed (10kph, 20kph, 30kph, etc), prop comparison (standard, low noise, carbon fiber, etc)


