

Hi guys, I've always seen this graph in the transmission settings and I don't exactly know how to read it and use it correctly.
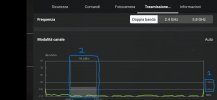
I know it shows you the interferences, channels ecc... but why does it say ≈1km and ≈4km (mark 1) and why do some areas of the graph get highlighted (mark 2)? Thanks to anyone who can help me understand.
I know it shows you the interferences, channels ecc... but why does it say ≈1km and ≈4km (mark 1) and why do some areas of the graph get highlighted (mark 2)? Thanks to anyone who can help me understand.